Introduction
Artificial Intelligence (AI) has been one of the most important driving forces for a rapidly advancing digital era. In financial industry, fund management companies (DFMC) have been applying AI to enhance their fund management performance and improve their customer services via digitalization. Supervised Machine-Learning (SML) is believed a most proper approach to creating AI for financial market, where a computer algorithm is trained on input data that has been labelled. The model is trained until it can detect the underlying patterns or relationships between the input data and the output labels, enabling it to yield accurate results when presented with never-before-seen data.
This blog introduces a robust & high-performance market signal-based asset allocation strategy with help of AI/SML. The market signal (bullish or bearish) is generated and updated daily applying our in-house proprietary quantitative volatility forecast model (trained via AI/SML). The volatility forecast model quantifies market sentiment as bullish or bearish, which drives asset allocation and rebalance. This strategy can accommodate any global asset classes (ETFs or stocks). This note focuses on constructing/analyzing simple, robust and high-performance portfolio. This may encourage our readers to continue monitoring the accuracy for our market signal forecasts or come up with their own strategy;
Quantify Market Sentiment with Forecasted Volatility
Volatility is one of the most important measures/features of financial asset time series. A robust volatility forecast is a key ingredient in risk management and asset allocation. A market sentiment forecast is proved to be a very effective indicator for an efficient asset allocation. In this note, we use most popular risk-aversion index, VIX, and their respective derivatives to predict whether the market is bullish or bearish (via our in-house SML/AI approach, committed to protect I.P.). Such binary daily signal is used to manage portfolio asset allocation & rebalance described in the next section.
Market Signal Based Asset Allocation & Rebalance
The ETFs/Stocks utilized for this strategy are categorified into two distinct groups: bullish and bearish. The bullish ETFs/Stocks include top performer stocks or equity ETFs such as SPY, QQQ, DIA, etc. The bearish ETFs include some fixed income (i.e., AGG, IFE, BNDX, etc) and alternative (GLD, DBC, etc). The market signal-based asset allocation is performed as follows:
1. Long (selected) bullish ETF/Stock or a set of bullish ETFs/Stocks if the market signal forecasted is bullish; otherwise,
2. Long Bearish ETFs (square bullish ETFs/Stocks first if the portfolio holds bullish ETFs/Stocks);
For this blog, asset rebalance refers to switch between bullish or bearish ETFs.
Back-Tested Performance (Feb-2007 to Feb 2021)
4.1 FNGS Market Signal Based Trade
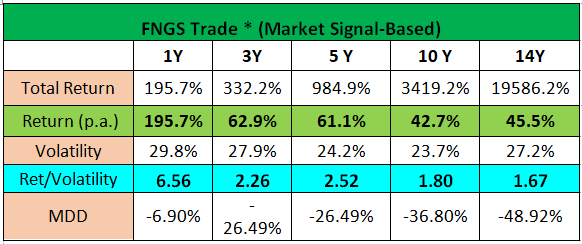
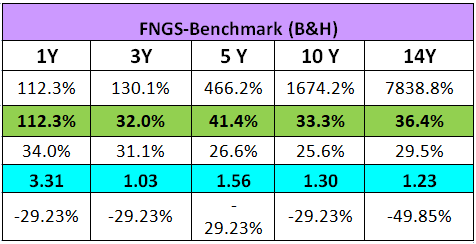
* Bullish: Long FNGS ; Bearish: long 45%GLD + 30% AGG + 20% IFE

Note : trade commissions cost ( 0.2% p.a.) is not factored in
4.2 QQQ Market Signal Based Trade
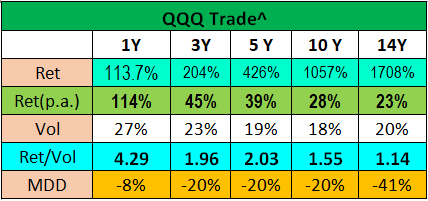
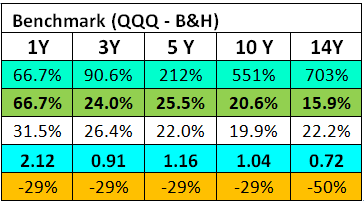
^ Bullish: long QQQ; Bearish long 45%GLD + 35%AGG + 20%IEF.
Back-Test data:
Feb-2007 to Feb-2021

Summary
Based on statistics of the back-tested data and analysis, we strongly recommend to our reader to follow/monitor our market daily signals updated weekly. This can help you to get better understanding on how good our fund management performance and services are , or even you can do your own trade following
Cheers!
Victor Lye BBM CFA CFP®
Founder & CEO, SqSave
PIVOT Fintech Pte. Ltd.
Annex A: Historical Market Signal Forecasted (1: bullish; -1:Bearish)

Annex B: FNGS complete holding lists

Disclaimer
The contents herein are intended for informational purposes only and do not constitute an offer to sell or the solicitation of any offer to buy or sell any securities to any person in any jurisdiction. No reliance should be placed on the information or opinions herein or accuracy or completeness, for any purpose whatsoever. No representation, warranty or undertaking, express or implied, is given as to the information or opinions herein or accuracy or completeness, and no liability is accepted as to the foregoing. Past performance is not necessarily indicative of future results. All investments carry risk and all investment decisions of an individual remain the responsibility of that individual. All investors are advised to fully understand all risks associated with any kind of investing they choose to do. Hypothetical or simulated performance is not indicative of future results. Unless specifically noted otherwise, all return examples provided in our websites and publications are based on hypothetical or simulated investing. We make no representations or warranties that any investor will, or is likely to, achieve profits similar to those shown, because hypothetical or simulated performance is not necessarily indicative of future results.


